XRP May Soar to $12 as Price Holds Cycle Bottom Zone for Months

XRP (XRP) is testing a key long-term support level that has historically preceded major rebounds, according to a monthly chart shared by analyst MikybullCrypto.
Key takeaways:
- XRP has jumped by roughly 30% from its February lows.
- Multiple fractals suggest the price is bottoming out, supported by strong XRP ETF inflows.
XRP chart hints at rebound toward $12
Milkybull’s chart shows XRP trading inside a rising channel that has guided price action since 2014. XRP is now near the channel’s lower trendline around $1.30–$1.40, a zone that previously acted as a launchpad for large upside moves.
XRP/USD monthly chart. Source: TradingView/MilkybullCrypto
The analyst says XRP is “probably going to $12,” a level that roughly aligns with the channel’s midpoint.
Momentum indicators support the rebound thesis. XRP’s monthly relative strength index (RSI) has cooled toward a historical support area near 40–45, similar to levels that appeared before past rallies.
In a Thursday post, analyst JD pointed to the same RSI support zone as a potential “cycle bottom” signal for XRP.
His two-week chart shows XRP breaking out of a multi-year symmetrical triangle, then pulling back toward the breakout area.
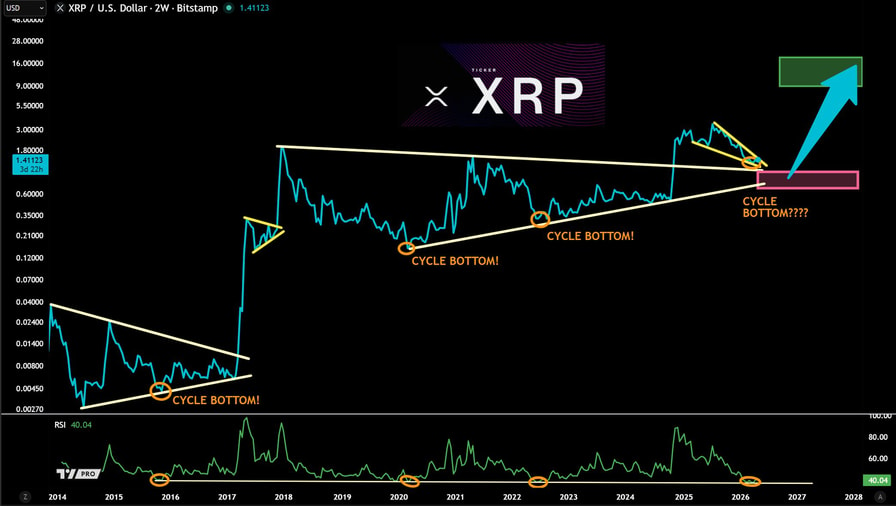
XRP/USD two-week chart. Source: TradingView/JD
The chart’s projected green target zone aligns with the $8–$14 range, implying strong upside if XRP holds the retest zone.
The bullish outlooks follow XRP’s sharp rebound in recent weeks, up by about 30% from its February lows at around $1.11.
Related: XRP price copies 2025 chart fractal that last time sparked 66% gains
In the period, XRP has largely benefited from renewed risk sentiment led by the US–Iran ceasefire, as well as market-specific fundamentals.
These include Rakuten Wallet’s XRP integration, which expanded the token’s reach in Japan, and $81.6 million in April inflows into US spot XRP ETFs, their strongest monthly total of 2026.
In the first week of May, XRP ETFs have attracted $28.17 million in inflows already.
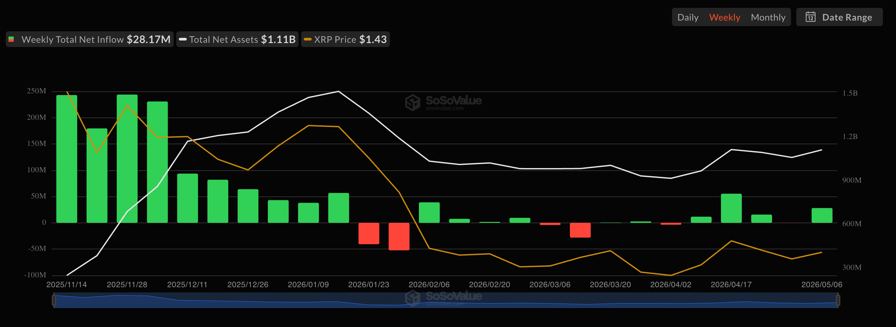
US XRP ETF net flows. Source: SoSoValue
XRP still risks 2022-style bear market repeat
However, the bullish XRP setup is not guaranteed. The bears will try to pull the price down below the channel support. This would invalidate the bullish structure and put XRP at risk of deeper losses.
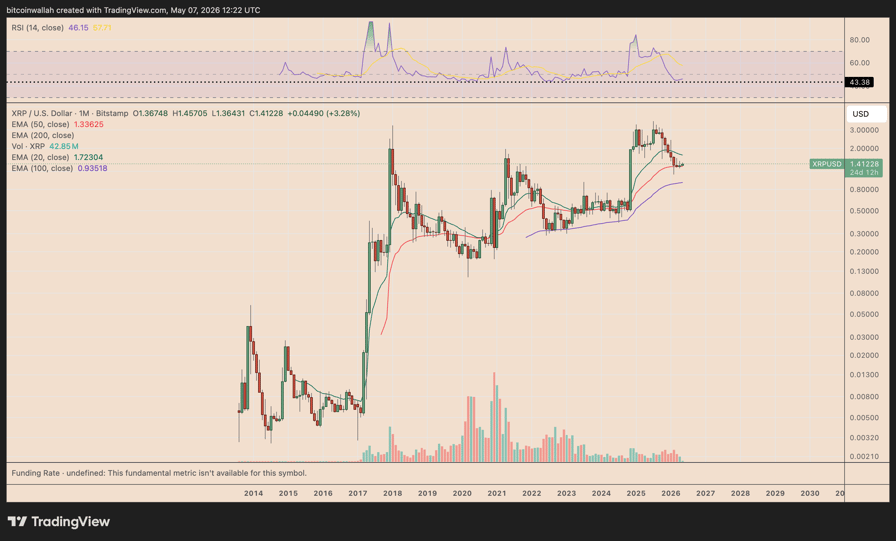
XRP/USD monthly chart. Source: TradingView
The support overlaps closely with XRP’s 50-month exponential moving average (50-month EMA, the red line) near $1.33.
Losing this support cluster shifts focus toward the 100-month EMA (the purple line) near $0.93, implying a roughly 30% drop from current levels. A similar plunge occurred during the 2022 bear market.